Batting average is the most quoted number in baseball and often the first statistic a new fan learns. When a commentator says a hitter is “batting .312” or that someone is “a .250 hitter”, that figure is their batting average, usually shortened to AVG or BA on a scoreboard. It is a simple ratio that rewards one thing above all else: getting hits. This guide explains what batting average measures, the exact formula, how to work it out step by step, what counts as an at-bat, how to tell a strong average from a weak one, and why seasoned fans treat it as only part of the picture.
Key Points
- Formula: batting average = hits ÷ at-bats, rounded to three decimal places.
- How it reads: .300 is said as “three hundred”; the leading zero is dropped.
- At-bats exclude walks, hit-by-pitches, sacrifice flies, sacrifice bunts and interference.
- A hit is a single, double, triple or home run reached without an error or fielder’s choice.
- .300 marks an excellent hitter; .200 is the Mendoza Line.
- Limitation: it ignores walks and treats every hit as equal, so fans pair it with OBP and OPS.
What batting average actually measures
Batting average tells you how often a batter gets a hit in the plate appearances that are scored as official at-bats. A hit is any time the batter safely reaches a base on a batted ball without the help of a fielding error or a fielder’s choice — in other words a single, double, triple or home run. The statistic does not care how far the ball travelled or how many runners scored; a scrappy infield single and a towering home run both count as exactly one hit.
Because it is a rate rather than a total, batting average lets you compare players who have had very different numbers of chances. A batter with 50 hits in 150 at-bats and a batter with 150 hits in 450 at-bats have both hit .333, even though one has three times as many hits. That is the appeal of the number: it expresses hitting success as a single, comparable rate.
The batting average formula
The formula is short:
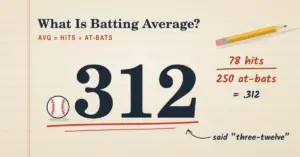
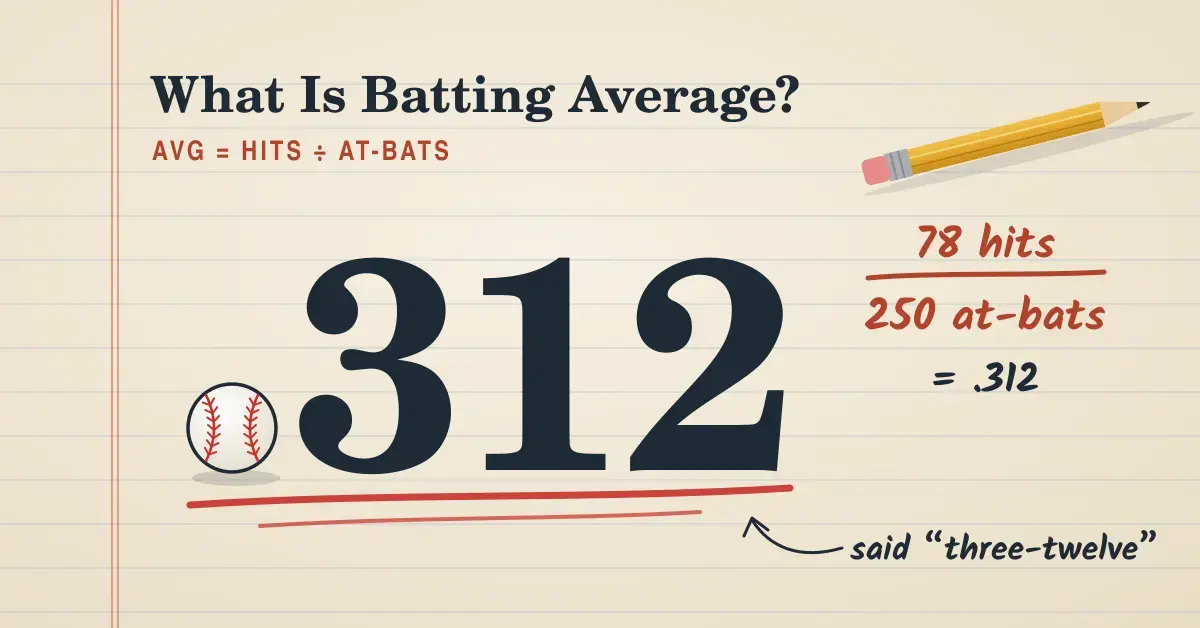
Batting average = Hits ÷ At-bats
The result is a decimal that is almost always rounded to three places and read without the leading zero. So a player who gets a hit in 30% of their at-bats has an average of 0.300, which everyone writes and says as “.300” (“three hundred”). A .275 average is read as “two seventy-five”. The three-decimal convention is standard across Major League Baseball and virtually every other league.
Rounding follows the usual rule: look at the fourth decimal place and round the third digit up if it is 5 or more. For example, 0.2984 rounds to .298, while 0.3336 rounds to .334. This is why you occasionally see averages that look oddly precise — the sport genuinely tracks hitting down to the thousandth.
What counts as an at-bat (and what does not)
The denominator is where most newcomers go wrong, because an at-bat is not the same as a trip to the plate. Every time a batter comes up is a plate appearance, but several outcomes are deliberately excluded from the at-bat count so that batting average measures only the situations where a hitter was genuinely trying to hit. A plate appearance is not charged as an at-bat when it ends in any of the following:
- A walk (base on balls), including an intentional walk
- A hit-by-pitch
- A sacrifice fly (a fly ball out that scores a runner)
- A sacrifice bunt (a bunt that advances a runner while the batter is put out)
- Catcher’s or fielder’s interference
Everything else — hits, strikeouts, groundouts, flyouts, line-outs and reaching base on an error or a fielder’s choice — does count as an at-bat. The practical effect is important: drawing a walk neither helps nor hurts your batting average, because it simply is not part of the calculation. That is why a patient hitter can have a modest average yet still be extremely valuable, a point that comes through clearly once you look at walks and the base on balls alongside the hit column.
A worked example
Imagine a batter over one week comes to the plate 25 times with the following results: 8 hits, 11 outs, 4 walks, 1 hit-by-pitch and 1 sacrifice fly. To find the batting average, first strip out everything that is not an at-bat. The 4 walks, the hit-by-pitch and the sacrifice fly are removed, which leaves 19 at-bats (8 hits plus 11 outs). Now divide:
8 hits ÷ 19 at-bats = 0.421
So this player is batting .421 for the week. Notice that if you had mistakenly used all 25 plate appearances as the denominator, you would have calculated .320 — a very different figure. Getting the denominator right is the single most common source of error when people try to compute an average by hand.
How to read a batting average
Context matters, because what counts as “good” shifts with the era, the level of play and the overall run-scoring environment. In modern Major League Baseball the league-wide average has sat around the .240s in recent seasons — the 2024 season finished at .243, close to the all-time record low of .237 set in 1968. Against that backdrop, the rough benchmarks below give a sense of how a season-long average is usually judged at the top professional level.
Batting Average Benchmarks
| Average | How it is usually judged |
|---|---|
| .300 and above | Excellent; elite contact hitter |
| .270 – .299 | Solid, above-average |
| .250 – .269 | Around league average |
| .220 – .249 | Below average |
| Near .200 | The Mendoza Line — struggling |
| Below .200 | Well short of a regular starting standard |
A few cultural markers are worth knowing. Crossing .300 over a full season is the traditional badge of an excellent hitter and is often the threshold for individual batting awards. At the other end sits the Mendoza Line — slang for an average of around .200, below which a hitter is considered to be struggling badly. The term is named after shortstop Mario Mendoza, a superb fielder whose light hitting (a .215 career average) left him hovering near .200, and it was popularised by team-mates and broadcasters in the late 1970s and early 1980s.
These numbers are much lower than they feel to outsiders. A .300 hitter fails to get a hit seven times out of ten, which is why baseball is often described as a game built on failure. Even the greatest hitters make an out far more often than not.
Batting average through baseball history
The record book shows just how extreme the best hitting seasons and careers have been. The figures below are long-standing marks that help calibrate what the statistic can reach at its peak.
| Record | Player | Figure | Notes |
|---|---|---|---|
| Highest career average | Ty Cobb | .366 | All-time record; a handful of sources cite .367 due to rounding |
| Highest modern-era season | Rogers Hornsby | .424 (1924) | Still the best single season of the modern era |
| Last .400 season | Ted Williams | .406 (1941) | No one has reached .400 over a full season since |
| The Mendoza Line | Mario Mendoza | ~.200 | The informal threshold of offensive struggle |
The fact that no player has topped .400 for a full season in more than eight decades says a great deal about how pitching, defensive positioning and relief specialists have raised the degree of difficulty for hitters over time.
Why batting average is only part of the story
For most of baseball history, batting average was the headline hitting number. Today it is treated as useful but limited, because it hides two things that win games. First, it ignores walks entirely, so a disciplined hitter who reaches base constantly can look ordinary by AVG alone. Second, it treats every hit as equal, so a single and a home run are scored identically even though one is far more valuable.
To fill those gaps, analysts lean on companion statistics. On-base percentage adds walks and hit-by-pitches to capture how often a batter avoids making an out, while slugging percentage weights hits by the number of bases. Combining the two gives you OPS, or on-base plus slugging, which many fans now prefer as a quick summary of overall offensive value. None of this makes batting average useless — it remains the cleanest measure of pure contact hitting — but it is best read next to those other numbers rather than on its own. If you are still finding your feet with the jargon, our beginner’s glossary of baseball terms defines each of these metrics in plain language.
It also helps to remember what batting average cannot do. It does not reward driving runners home — that job belongs to runs batted in (RBI) — and it says nothing about a player’s fielding, baserunning or the quality of the pitchers they faced. A complete picture of a hitter always draws on several statistics at once.
Common misconceptions to avoid
- Walks lower your average. They do not. A walk is removed from the calculation entirely, so it leaves your batting average exactly where it was.
- Reaching base on an error counts as a hit. It does not. The at-bat still counts in the denominator, but no hit is credited, so an error actually drags the average down.
- A higher average always means the better hitter. Not necessarily. A .260 hitter who walks often and hits for power can produce more runs than a .290 hitter who rarely does either.
- Batting average and plate appearances are the same denominator. They are not — only official at-bats go on the bottom of the fraction.
Batting average for Kiwi players and fans
For players and parents in the Wellington region, batting average is an easy statistic to start tracking at club and youth level, because all you need is a reliable count of hits and at-bats from the scorebook. It is a motivating number for young hitters, but coaches here increasingly frame it the same way the professional game does: as one signpost among several rather than the only measure of a good season. A player who makes consistent contact, runs the bases well and draws walks is developing the right habits even when the average is modest. If you want practical ways to lift that number at the plate, our guide to the top hitting tips for baseball players and the broader skills and development pathway for Kiwi players set out how contact, timing and plate discipline build together over a season.
Sources
Frequently asked questions (FAQ)
How do you calculate batting average?
Divide a player’s total hits by their total official at-bats, then round the result to three decimal places. For example, 45 hits in 150 at-bats is 45 ÷ 150 = .300. Walks, hit-by-pitches and sacrifices are left out of the at-bat count, so they do not affect the result.
What is considered a good batting average?
At the top professional level, an average of .300 or higher over a full season is regarded as excellent, the .270s are solid, and the .240s are roughly league average in the current era. Anything near .200 — the Mendoza Line — is considered a struggle. Benchmarks are lower at the professional level than casual fans often expect, because even elite hitters make an out most of the time.
Do walks count in batting average?
No. A walk is a plate appearance but not an at-bat, so it is removed from the calculation completely and has no effect on batting average either way. Walks do, however, improve a hitter’s on-base percentage, which is one reason analysts look beyond batting average alone.
Who has the highest batting average in baseball history?
Ty Cobb holds the highest career batting average at .366 (some sources list it as .367 due to rounding). The highest modern-era single season belongs to Rogers Hornsby at .424 in 1924, and Ted Williams was the last player to bat over .400 for a full season, hitting .406 in 1941.
What does AVG mean on a baseball scoreboard?
AVG is simply the abbreviation for batting average; you may also see it written as BA. The three-digit figure shown — such as .285 — is the player’s hits divided by at-bats, rounded to three decimal places and displayed without the leading zero.